
POOL: Pricing the Cycle, Missing the Annuity
The Inflection Brief: Under the Hood of Global Equities

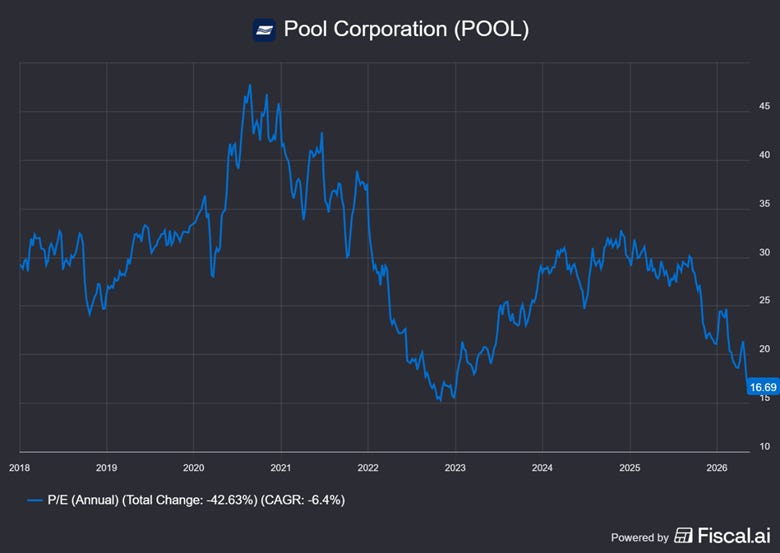
POOL is a quality compounder being priced as a cyclical distributor. The world’s largest wholesale distributor of swimming pool supplies surfaced on the 52-week low list at 2020 prices—16.7x trailing earnings, 2.8% yield, a refreshed $600M buyback, and a 16-year run of consecutive dividend increases. Sixty-four cents of every revenue dollar is non-discretionary maintenance and minor repair tied to an aging installed base of swimming pools that age, leak, and need chlorine regardless of housing turnover. That recurring base has grown from 60% in 2019 to 64% today.
The COVID-era rerating from 40x to 16x is done. The setup isn’t waiting on a single catalyst—it’s the recurring-revenue base compounding underneath while the market keeps pricing the new-construction cycle as the whole story.
The question is whether the market is right about the cycle—or wrong about the annuity.
(Skip to the bottom under: ‘Bull Thesis’ for a summary of the report.)

Why Now
$POOL from the 52-week low list. Trading at price levels last seen over 6 years ago in 2020. The market has already done the re-rating work—POOL is no longer priced like a growth compounder, at 16.7x trailing earnings with a near-3% yield. It’s a mature distributor with cyclical exposure continuing to pursue growth strategies.
The problem with quality compounders is the ability to own them at a reasonable price—the trends over the past 6 years have gotten us within the range of “reasonable price.” POOL closed at $181.69 on May 21st, 2026. I want to be clear that a stock that has gone down (specifically this long and this hard) can continue to do so without an apparent catalyst.
Q1 2026 Buyback Execution: A Baseline of Conviction. The Board’s late-April 2026 decision to refresh the share repurchase authorization to a massive $600.0 million grabbed headlines, but the company’s actual open-market execution leading up to that moment is telling. During the first quarter of 2026, POOL deployed $64.4 million to repurchase its own stock. Notably, the vast majority of this activity occurred in March 2026, with the company aggressively buying up over 295,000 shares at an average price of $203.04.
This Q1 execution is a critical data point because it proves management was already using cash to aggressively shrink the share count before the Board refreshed the authorization and before the abrupt May CEO transition occurred. It establishes a clear baseline: the company fundamentally believed the stock was deeply undervalued and a prudent use of capital even at the $200+ level.
When the stock subsequently sold off into the $190 range following Peter Arvan’s departure, the new $600 million authorization effectively armed the company to buy at prices significantly below its already established “value” threshold. Coupled with the heavy insider buying from the Executive Chair and long-time Board members in May, this pre-existing corporate buyback cadence reinforces the thesis that the market is mispricing the company’s recurring revenue base at current levels.
A “Green Shoot” in Operating Leverage. Over the past year, operating leverage was running in reverse. In 2025, the company experienced a brutal margin squeeze, with operating income dropping 6% despite net sales remaining flat compared to the prior year. But the first quarter of 2026 revealed a critical inflection point that signals a positive shift in momentum. In Q1 2026, net sales increased 6% year-over-year to $1.138 billion, and operating income finally outpaced that top-line growth, increasing 7% to $82.6 million. This Q1 print suggests that management is successfully right-sizing the cost structure and that the recent SG&A investments—specifically in new greenfield locations and consumer-facing technology—are finally beginning to yield profitable top-line growth.
Management is Signaling the Cyclical Bottom is In. While new in-ground pool construction has collapsed from its pandemic peaks down to an estimated 60,000 units in 2025, management’s latest outlook signals that the cyclical bottom is finally in. In its 2026 guidance, management explicitly modeled for new construction units to remain “consistent... to 2025” and for renovation and remodel activity to be “flat to slightly up.” This is a critical inflection point for the investment thesis because management is no longer guiding for the macroeconomic cycle to worsen. With discretionary new pool construction making up just 14% of revenue, if management’s baseline assumption holds, the multi-year drag from the cyclical side of the business is officially over. This stabilization leaves the company’s highly resilient, non-discretionary maintenance segment—which accounts for 64% of total sales—free to drive the top and bottom lines upward.
Growth
Indicators of Continued Growth: Despite its mature corporate profile, POOL does not view its market as fully saturated. The company has historically described the swimming pool industry as “relatively young, with substantial room for continued growth from the increased penetration of new pools.” It actively reinvests in the business to capture this growth through:
Expansion: Opening new “greenfield” sales center locations and executing strategic acquisitions, such as its massive 2021 purchase of Porpoise Pool & Patio (which included the Pinch A Penny retail franchise network). To capture more of this available market and drive further share gains, the company’s strategy includes opening 5 to 8 new sales centers annually, pursuing selective strategic acquisitions, and expanding its product offerings, particularly its proprietary and exclusive brands.
Technological Upgrades: Capitalizing on the aging installed base of swimming pools by selling higher-value, enhanced-feature products like automated controls, robotic cleaners, LED lighting, and energy-efficient variable speed pumps.
Digital and Commercial Focus: Investing heavily in its POOL360 B2B digital ecosystem to improve customer integration and deliberately expanding its reach into the commercial pool market (hotels, universities, and community facilities).
TAM: The total addressable market is massive, servicing approximately 11.0 million bodies of water (including 5.4 million in-ground pools) in the U.S. alone, alongside a $19.0 billion addressable market for residential and commercial irrigation and landscape maintenance. As of writing, POOL’s market cap sits around $6.61 billion, leaving much room for growth within its niche.
International: 48 locations (~10.5% of total footprint): The international operations are conducted entirely through the SCP International network and are distributed across the following countries:
North America (excluding U.S.): Canada (17), Mexico (5)
Europe: France (9), Portugal (3), Italy (2), Spain (2), Belgium (1), Croatia (1), Germany (1), United Kingdom (1)
Australia: 6 locations
Management has consistently delivered on its stated goal of opening 8 to 10 new sales centers annually (now guiding 5-8), meeting or exceeding this target in almost every year since 2019. The only exception was in 2020, when the company deliberately deferred planned sales center openings to preserve capital at the onset of the COVID-19 pandemic.
Management has consistently followed through on its statements and outlook, and is focused on growing its international footprint. The company’s recent international acquisitions include purchasing A.C. Solucoes para Piscinas, Lda. in Portugal (December 2023), Northeastern Swimming Pool Distributors in Ontario, Canada (September 2020), and Tore Pty. Ltd. (Pool Power) in Australia (January 2018). Geopolitics and uncertainty add risks to the international initiative and should be watched closely.
Key Business Drivers
The Installed Base of Pools (Non-Discretionary Demand): The sheer size and aging of the existing pool market is POOL’s most vital driver. Approximately 60% to 64% of consumer spending in the pool industry goes toward routine maintenance and minor repairs (e.g., chemicals, pumps, filters). This creates a recurring, non-discretionary revenue stream that buffers the company’s performance during periods of economic softness.
Macroeconomic and Housing Market Trends: Discretionary expenditures—such as new pool construction (14% to 18% of sales) and major remodeling (21% to 23% of sales)—are heavily influenced by broader economic variables. The most critical macroeconomic drivers include home value appreciation, single-family housing turnover, consumer confidence, employment levels, and the availability of consumer credit at favorable borrowing rates.
Weather and Seasonality: Weather is a principal external factor affecting the business, with roughly 60% of sales typically generated in the second and third quarters. Hot, dry weather and early spring warming trends positively impact sales by extending the pool season and increasing the use of chemicals and supplies. Conversely, unseasonably cool weather, excessive rainfall, or drought-related municipal water restrictions can significantly impede growth and installation activity.
Technological Advancements and Sustainability: There is an ongoing consumer shift toward environmentally sustainable, energy-efficient, and aesthetically attractive products. Demand is increasingly driven by upgrades to automated smart controls, robotic cleaners, LED lighting, and variable speed pumps. Growth in variable speed pumps has been specifically accelerated by U.S. Department of Energy compliance mandates.
Product Cost Inflation: Inflationary pricing increases on products from manufacturers are generally passed directly through to customers, which acts as a driver for top-line sales growth.
Management Outlook and Follow-Through
Outlook
Management remains confident in the company’s long-term trajectory, viewing the swimming pool industry as having inherent growth opportunities fueled by an aging installed base, favorable population migration trends, and consumer shifts toward sustainable, energy-efficient products.
However, management acknowledges that the macroeconomic environment in recent years (2023–2025) has caused consumer hesitancy on discretionary projects. For the full year 2026, management’s outlook expects a return to modest growth:
Sales: Projected to see a low single-digit percentage increase compared to 2025, assuming normal weather patterns and stable maintenance demand.
Margins and Expenses: Gross margin is expected to remain similar to 2025 at approximately 29.7%, benefiting from effective supply chain management and private label sales. Operating expenses are expected to increase by around 3% as the company manages discretionary spending but continues investing in its sales center network and technology.
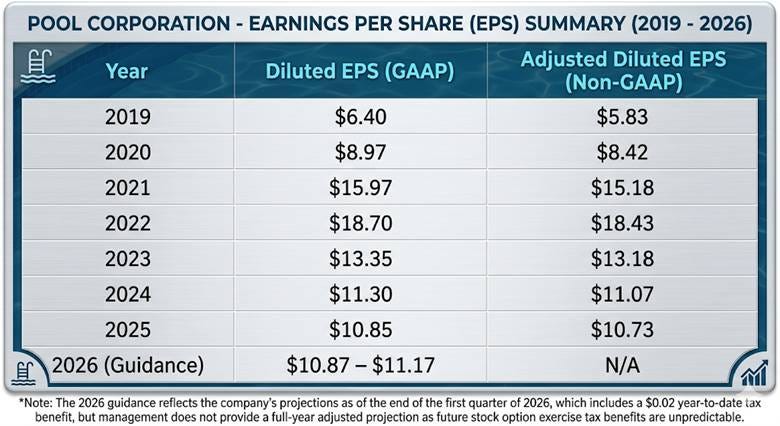
Earnings: Diluted EPS is guided to be in the range of $10.87 to $11.17.
Follow-Through on Strategic Initiatives and Promises
Management has a strong track record of following through on its stated operational and financial goals:
Sales Center Expansion: As discussed previously, management has consistently promised 8 to 10 new sales centers annually. They followed through closely on this, opening 9 greenfield locations (and acquiring 2) in 2024, and opening 8 greenfield locations (and acquiring 3) in 2025. Going into 2026, they have slightly adjusted this target, planning to open 5 to 8 new locations.
Financial Execution: Following the unprecedented demand surge during the pandemic, the industry experienced a sharp normalization. Despite these headwinds, management successfully maintained net sales above the $5.0 billion mark for five consecutive years (2021–2025) and preserved a double-digit operating margin.
Long-Term Delivery: While the 1-year and 3-year Total Shareholder Return (TSR) have faced recent headwinds, management has delivered exceptional long-term follow-through. Over the past 10 years, they have achieved an 8% compound annual growth rate (CAGR) in net sales, a 10% CAGR in operating income, and a 14% CAGR in diluted EPS.
Acquisitions and Acquisition Strategy
Pool Corporation actively uses strategic acquisitions to further penetrate existing markets, expand into new geographic areas, and add new product categories. Executing opportunistic, “bolt-on” acquisitions is one of the company’s primary and ongoing capital allocation priorities. The company regularly evaluates potential targets but maintains a strict policy of not announcing transactions until they are fully completed, unless required by regulatory rules.
The Transformational Acquisition: Porpoise Pool & Patio (2021): The most significant acquisition in the company’s recent history occurred in December 2021, when Pool Corporation acquired Porpoise Pool & Patio, Inc. for approximately $788.7 million. This was a massive strategic move that expanded the company’s reach in the retail space. The acquisition included:
Pinch A Penny, Inc.: A franchisor of roughly 260 independently owned and operated pool and outdoor living specialty retail stores, predominantly in the Southeastern U.S.
Sun Wholesale Supply: A wholesale distributor that primarily services the Pinch A Penny franchisees.
Chemical Packaging: An in-house specialty chemical packaging plant located in Florida.
Because of its sheer size, the Porpoise acquisition fundamentally transformed POOL’s balance sheet, generating $403.5 million in goodwill and $301.0 million in other identifiable intangible assets, which included the Pinch A Penny brand name and franchise agreements.
Recent “Bolt-On” Acquisitions (2022–2025): Outside of the Porpoise transaction, POOL consistently executes smaller acquisitions to acquire local distribution assets, typically adding one to three sales center locations at a time. While management notes that these smaller purchases generally do not have a material financial impact individually, they are a vital supplement to the company’s organic “greenfield” expansion strategy.
Recent transactions include:
2025: Acquired Vegas Stone Brokers (a stone and hardscapes supplier adding one location in Nevada) and Great Plains Supply and Spa Products (adding locations in Kansas and Texas).
2024: Acquired Swimline Distributors, Inc. (one location in Georgia) and Shoreline Pool Distribution (one location in Mississippi).
2023: Acquired A.C. Solucoes para Piscinas, Lda. (one location in Portugal), Pioneer Pool Products (one location in Alabama), Recreation Supply Company (a commercial pool products distributor in North Dakota), and Pro-Water Irrigation & Landscape Supply (adding two locations in Arizona).
2022: Acquired Tri-State Pool Distributors (adding one location in West Virginia).
Overall, these acquisitions serve as a reliable tool for Pool Corporation to steadily consolidate a highly fragmented industry and secure local market share.
Moat
Pool Corporation’s market share has been consistently increasing. While management has proved capable of delivering on promises and strategically allocating capital, the largest differentiators that allow it to continue taking market share are its size within the industry and its customer service. Its moat consists of:
Scale and Distribution Network Density: Pool Corporation is the world’s largest wholesale distributor of swimming pool supplies and one of the few national wholesale distributors focused specifically on the swimming pool industry in the United States. With 456 sales centers globally and several centralized shipping locations, the company offers unmatched geographic proximity to its customers. This immense physical footprint allows POOL to maintain local, well-stocked inventories that fulfill immediate customer needs.
A Highly Fragmented Customer Base: The company serves roughly 125,000 wholesale customers, with no single customer accounting for 10% or more of its sales. The vast majority of these customers are small, entrepreneurial, family-owned businesses with limited capital and fewer than ten employees. Because these small operators lack the resources to hold significant inventory or negotiate directly with large manufacturers, they are highly reliant on POOL’s broad product selection, competitive pricing, extended payment terms (early buy programs), and value-added support.
Comprehensive and Exclusive Product Offerings: POOL serves as a “one-stop shop” by offering the most comprehensive selection in the industry, featuring more than 200,000 products across 650+ product lines. Crucially, this includes high-margin proprietary and exclusive brands (PLEX)—such as Regal, E-Z Clor, SuperPro, and PoolStyle—which differentiate POOL from its competitors and protect its margins.
Value-Added Services and Retail Support: POOL acts as a business partner rather than just a supplier. It provides uniquely tailored marketing tools, lead generation, and business development training. For its retail customers, it even assists with site selection, store layout, product merchandising, and inventory management. Furthermore, the company operates consumer showrooms where contractors and homeowners can use tools like the NPT Backyard app to virtually design and customize their pools, giving POOL a distinct advantage in capturing discretionary, big-ticket remodeling sales.
Purchasing Power and Supplier Value: Operating in a highly fragmented industry, POOL serves as the vital intermediary between major global manufacturers (like Pentair, Zodiac, and Hayward) and the thousands of small businesses installing and servicing pools. This scale gives the company immense bargaining power to secure competitive pricing, return policies, and promotional allowances from its vendors, creating a barrier to entry that is difficult for smaller regional distributors or new entrants to replicate.
Recurring Revenues: 64% of revenue is recurring maintenance and repair revenue.
Competition
Pool Corporation holds a commanding position as the world’s largest wholesale distributor of swimming pool and related backyard products, and it is one of the few national wholesale distributors focused specifically on the U.S. swimming pool industry. It is also one of the leading distributors of irrigation and landscape maintenance products in the country.
Despite its unmatched scale, the company faces competition from several different angles:
Direct Industry Competitors: Pool Corporation directly competes against numerous local, regional, and national wholesale distributors to win the business of pool professionals, contractors, and end-use customers. This competition is exceptionally intense in high-density pool markets—specifically California, Florida, Texas, and Arizona—which collectively account for over half of the company’s total net sales. To successfully compete against these rivals, the company relies heavily on maintaining a broad availability of products, competitive pricing, geographic proximity, and high-quality customer service, including fast product delivery.
Indirect Retail & E-commerce Competitors: The company faces persistent indirect competition from store-based mass-market merchants and large pool and irrigation supply retailers, which typically bypass distributors to purchase their inventory directly from manufacturers. While these mass-market retailers currently dedicate limited shelf space to pool products, any strategic expansion of their pool and irrigation offerings could turn them into a much more significant competitive threat. Furthermore, e-commerce and internet retailers intensify this pressure, as the internet facilitates competitive entry, price transparency, and comparison shopping.
Alternative Discretionary Purchases: Because new pool construction and major remodeling projects represent a highly discretionary portion of consumer spending, the company competes indirectly for the consumer’s dollar against other big-ticket leisure and home improvement alternatives. When deciding to build or upgrade a pool, consumers weigh the purchase against alternatives such as boats, motor homes, recreational vehicles, vacations, or kitchen and bathroom remodeling. During periods of economic uncertainty, inflation, or tightening credit markets, consumers may choose to defer these discretionary expenditures entirely.
Low Barriers to Entry: The barriers to entry in the pool and landscape supply distribution industry are relatively low. This lack of friction has cultivated a highly fragmented and competitive market populated by entities of all sizes, ranging from small, local “mom-and-pop” operators to larger regional businesses. The ease of entering the market is further accelerated by the internet, which lowers the threshold for new competitors to establish an online presence and compete directly on price.
Industry Trends
Demographic and Lifestyle Shifts: The industry is benefiting from long-term population migration toward the warmer southern United States, where outdoor home entertainment is more prevalent. Additionally, remote and hybrid work trends have prompted homeowners to view their backyards as an extension of their home space, leading to increased investments in outdoor living spaces for relaxation and entertainment. Consumers are also increasingly bundling pool installations and remodels with other outdoor enhancements, such as irrigation systems, landscaping, hardscapes, and outdoor kitchens.
Technological Advancements and Sustainability: There is an ongoing consumer shift toward environmentally sustainable, energy-efficient, and aesthetically attractive products. Significant growth opportunities exist in the adoption of automated smart controls, robotic cleaners, LED lighting, and variable speed pumps. The adoption of variable speed pumps has been further accelerated by U.S. Department of Energy compliance mandates.
Aging Installed Base and Recurring Revenue: Approximately 60% to 64% of consumer spending in the pool industry goes toward the non-discretionary maintenance and minor repair of existing pools. This recurring revenue acts as a buffer during economic downturns. Simultaneously, the aging of the installed base of pools is a primary driver for the remodeling, renovation, and upgrade market, which accounts for roughly 21% to 23% of consumer spending.
Post-Pandemic Market Normalization: Following unprecedented demand during the COVID-19 pandemic, new pool construction has moderated significantly. New in-ground pool construction surged to approximately 120,000 units in 2021 but has steadily declined to an estimated 60,000 units in 2025 due to cyclical suppression of demand and macroeconomic pressure. Management has guided that this will even out in 2026.
Risks to Business
Uncertainty around executive replacement and delayed Investor Day: This should be monitored closely before considering an investment. Appointment of John B. Watwood as CEO to succeed Peter D. Arvan. The transition was rushed. The Investor Day that was supposed to land May 12 has been postponed indefinitely. Both warrant caution.
Macroeconomic Pressures on Discretionary Demand: Since the pandemic peak, discretionary spending on new pools and remodels has significantly declined due to elevated interest rates, product cost inflation, and lower existing home turnover.
Extreme Weather Sensitivity: The company’s operations are highly seasonal, generating approximately 60% of net sales and over 70% of operating income in just the second and third quarters. Unseasonably cool or wet weather during this short window can severely impact results. Over half of the company’s entire revenue is generated in just four states. In 2025, California, Florida, Texas, and Arizona collectively represented approximately 53% of total net sales.
Significant Supplier Concentration: Pool Corporation relies heavily on a limited number of manufacturers. In 2024, its top three suppliers—Pentair plc, Zodiac Pool Systems, Inc., and Hayward Pool Products, Inc.—accounted for roughly 43% of the company’s total cost of products sold (20%, 12%, and 11%, respectively).
Operating Cost Inflation and Margin Pressures: Even when top-line sales stabilize, the company faces pressure from its cost structure. In 2025, operating income declined 6% year-over-year (or 4% when excluding a one-time import tax benefit realized in 2024) despite flat sales. This margin compression was primarily driven by a 4% increase in operating expenses stemming from inflationary pressures on base wages and facility costs, alongside necessary ongoing investments in technology and sales center expansions. The company also faces inherent inventory management risks; carrying excess, higher-cost inventory (which pressured 2024 gross margins) or underestimating seasonal demand can quickly squeeze profitability.
Exposure to Tariffs and Import Regulations: Because the company sources products globally, changes in trade policies, duties, and tariffs present both cost and compliance risks. The complexity of these regulations can create sudden margin fluctuations. For instance, the company had to record a $13.0 million charge in the fourth quarter of 2022 related to an inadvertent misclassification of imported chemicals from China. While the company successfully resolved this issue and recorded a $12.6 million reversal in the first quarter of 2024 (which artificially benefited 2024 gross margins by 20 basis points), the incident highlights the ongoing compliance risks and potential margin volatility associated with global sourcing.
The Inherent Risk of the Porpoise Goodwill: The Porpoise reporting unit carries $401.6 million in goodwill, which accounts for the vast majority of Pool Corporation’s $707.3 million total goodwill balance. Because of its massive size, the company’s independent auditors have explicitly flagged the annual impairment testing for this specific unit as a “complex and highly judgmental” matter. During the company’s most recent annual goodwill impairment test in October 2025, it did not record any impairment charges for the Porpoise reporting unit.
Important Financial Metrics
Operating Income: This is the primary financial performance metric used for annual executive bonuses. Management views operating income as a strong indicator of medium- and long-term stockholder value because it is highly objective and has had a strong long-term correlation with POOL’s stock price over time.
Return on Invested Capital (ROIC): This serves as a critical threshold performance metric. The company must achieve an ROIC of 10% or higher to fund the annual bonus pool for its executive officers.
Adjusted Net Cash Provided by Operations: This operational cash flow metric is used alongside operating income to determine the annual incentive payouts for top executives, such as the CEO and CFO.
Average Total Leverage Ratio: A critical debt covenant metric measured on the last day of each fiscal quarter. It is calculated as the trailing twelve months (TTM) average total funded indebtedness plus securitization proceeds divided by TTM EBITDA. POOL is required to maintain this ratio below 3.25 to 1.00.
Base Business Sales Growth and Gross Margin: These core distribution metrics are closely tracked to evaluate market share gains and pricing power. Gross margin is heavily influenced by product mix; for instance, increased sales of higher-margin private label and exclusive products (PLEX) help offset the margin dilution from lower-margin, big-ticket equipment sales.
Financial Analysis
Capital Allocation and Strategies
Capital Allocation Strategies: Pool Corporation employs a highly disciplined and clearly prioritized capital allocation strategy. Its stated priorities for deploying cash are:
Capital Expenditures: Investing primarily in the maintenance and growth of the sales center network, technology-related investments (like the POOL360 digital ecosystem), and fleet vehicles. CapEx has historically averaged roughly 1.0% of net sales, and management projects this to be between 1.0% and 1.5% for 2026.
Working Capital: Funding inventory and other day-to-day operating expenses (Product inventories are 40% of total assets).
Strategic Acquisitions: Executing opportunistic bolt-on acquisitions to expand geographically or add product capabilities.
Cash Dividends: Returning cash directly to shareholders. In April 2026, the Board announced a 4% increase in the quarterly dividend to $1.30 per share, marking the 21st annual dividend increase and 16th consecutive since the program began in 2004.
Debt Repayment: Maintaining a prudent, modest debt structure with a target average total leverage ratio between 1.5 and 2.0.
Share Repurchases: Using remaining cash for discretionary open-market stock buybacks. In April 2026, the Board added $600.0 million to the repurchase authorization.
The sheer volume of capital returned to shareholders highlights the success of these strategies. In 2025 alone, the company returned a total of $346.3 million in share repurchases and $184.9 million in dividends. Zooming out, the company has returned $3.33 billion in total cash to its investors over the 10-year period from 2016 through 2025.
Revenue Breakdown
Pool Corporation’s revenue composition can be broken down in several distinct ways, primarily by end-market use, product category, customer type, and geography.
By End-Market Use: The company’s revenue is heavily weighted toward non-discretionary, recurring spending driven by the existing installed base of pools. In 2025, its sales composition by end-market activity was:
64% from recurring maintenance and minor repairs of existing pools.
22% from pool remodeling, renovations, and upgrades (which are considered partially discretionary).
14% from new pool construction (which is highly discretionary).
By Product Category: Looking at the specific types of products sold, the company’s net sales are largely driven by a few major categories:
Equipment (such as heaters, pumps, lights, filters, and automation devices) represents approximately 31% of net sales.
Chemicals account for approximately 15% of net sales.
Building materials (primarily used in new pool construction and remodeling projects) represent approximately 12% of net sales.
By Customer Type: While the vast majority of POOL’s revenue comes from small, independent wholesale customers like pool builders and service and repair companies, it also breaks out revenue for specific customer segments:
Retail customers (specialty retailers that sell swimming pool supplies) account for approximately 14% to 15% of consolidated net sales.
Commercial customers (businesses that service large commercial installations like hotels, universities, and community recreational facilities) represent about 5% of net sales.
By Geography: From a geographic standpoint, the company’s revenue is overwhelmingly domestic. North America (which the company defines as the U.S., Canada, and Mexico) generates approximately 94% to 95% of total net sales, with the remaining single-digit percentage coming from its international operations in Europe and Australia. Furthermore, over half of the company’s total net sales are heavily concentrated in just four key high-pool-density states: California, Florida, Texas, and Arizona.
EPS
Cost of Products Sold (Inventory and Supply Chain)
Inventory Purchases and Supplier Concentration: As a distributor, the single largest cost the company incurs is purchasing the products it sells. This cost is heavily driven by a concentrated group of suppliers; in 2024, just three manufacturers (Pentair plc, Zodiac Pool Systems, Inc., and Hayward Pool Products, Inc.) accounted for 43% of the company’s total cost of products sold.
Product Inflation: The cost to acquire products is directly driven by manufacturer price increases, which the company generally passes through to its customers. While inflation surged significantly during the pandemic, it moderated to a historical average of about 1% to 2% in 2024.
Tariffs and Import Duties: Because the company sources products globally, fluctuating import regulations, duties, and tariffs act as a direct driver of supply chain costs.
Operating Expenses (Selling and Administrative)
Labor and Compensation: Employee-related expenses are consistently cited as the primary driver of operating expense growth. This includes base wages, healthcare, and insurance costs. Additionally, performance-based compensation is a highly variable cost driver that fluctuates significantly based on the company’s financial performance.
Facilities and Rent: The company operates a massive physical footprint of over 450 sales centers across North America, Europe, and Australia. Rent, occupancy costs, and the expenses associated with expanding the network by opening new “greenfield” sales centers are major ongoing cost drivers.
Freight and Transportation: Inbound freight (which is recorded in cost of sales) and outbound freight and delivery (which is recorded in operating expenses) are significant costs that are heavily influenced by sales volumes and fluctuating fuel prices.
Technology Investments: The company has deliberately increased its operating expenses in recent years by heavily investing in its digital transformation initiatives. Funding the continued development of platforms like its POOL360 B2B ecosystem and other customer-facing mobile apps remains a primary driver of administrative cost growth.
Assets
The largest asset on Pool Corporation’s Balance Sheet is product inventories. As of December 31, 2025, the company held approximately $1.45 billion in net product inventories, which accounted for roughly 40% of its $3.63 billion in total assets. By the end of Q1 2026, inventory had swelled to $1.66 billion (representing 41.5% of total assets) due to seasonal “early buy” programs ahead of the summer season. Management views this as a critical asset because maintaining adequate inventory of its highest-volume products prevents stock-outs and is essential to providing the highest level of service to its customers. (Implications: watch inventory turnover closely).
As of December 31, 2025, Pool Corporation’s intangible assets were valued at approximately $991.2 million in total, making up over a quarter of the company’s total assets. This balance consists of Goodwill and Other Intangible Assets.
The vast majority of the company’s identifiable intangible assets (Pinch A Penny brand name, customer relationships, and franchise agreements) were acquired during the December 2021 purchase of Porpoise Pool & Patio.
Debt
A Leveraged Capital Structure: The company operates with a relatively low cash balance ($64.5 million in Q1 2026) and relies heavily on debt. As of the end of Q1 2026 (March 31, 2026), Pool Corporation reported total debt of $1.25 billion. Compared to its total stockholders’ equity of $1.13 billion for the same period, the company’s debt-to-equity ratio sits at approximately 1.10 (or 110%).
However, management primarily measures its debt utilization using an Average Total Leverage Ratio. Its stated goal is to maintain a target leverage ratio between 1.5 and 2.0. As of March 31, 2026, the company’s actual average total leverage ratio was 1.73, meaning it is operating comfortably within its target range and remains well below the maximum allowable limit of 3.25 dictated by its credit covenants.
POOL has a healthy current ratio of 1.9. The recent $222.6 million year-over-year increase in debt heading into 2026 was explicitly used to help fund $346.3 million in open-market share repurchases. The company’s debt structure includes:
$500.0 million term loan (under the credit facility)
$346.8 million revolving credit facility
$300.0 million receivables securitization facility
$90.0 million term facility
Operating Cash Flows and Seasonal Drivers
Pool Corporation is a strong cash generator, though its operating cash flows are highly subject to the extreme seasonality of the swimming pool industry and strategic working capital investments.
Recent Performance: In 2025, the company generated $365.9 million in net cash provided by operations, down from $659.2 million in 2024.
The Hurricane Tax Anomaly: This year-over-year drop was heavily skewed by a $68.5 million federal tax payment. Because of IRS relief following Hurricane Francine, the company was allowed to defer this payment from 2024 into February 2025. This artificially inflated 2024’s cash flow and depressed 2025’s cash flow. When excluding this deferred tax payment, the company’s 2025 operating cash flow was actually exceptionally strong, representing 106.9% of its net income.
Inventory and Early Buys: A major driver of cash flow fluctuations is the company’s inventory strategy. The company typically experiences a massive build-up of product inventories and accounts payable during the winter and early spring to prepare for the peak summer season. POOL uses supplier “early buy” programs, which allow it to place discounted orders in the fall, take off-season delivery, and use cash to pay for them in the spring or early summer.
Investing and Financing Cash Flows
The cash generated from operations is purposefully funneled into the company’s investing and financing activities to fuel growth and reward investors:
Investing (CapEx and Acquisitions): The company uses cash to execute opportunistic, “bolt-on” acquisitions and fund capital expenditures (CapEx). CapEx is relatively light, historically averaging roughly 1.0% of net sales (projected at 1.0% to 1.5% for 2026), and is primarily spent on new and existing sales centers, technology (like the POOL360 digital ecosystem), and fleet vehicles.
Financing (Shareholder Returns): Financing cash flows are dominated by the company’s commitment to returning capital to stockholders. In 2025 alone, Pool Corporation returned a massive $531.2 million to investors, using $346.3 million for share repurchases and $184.9 million for cash dividends. The company frequently uses a revolving credit facility and a receivables securitization facility to help bridge seasonal borrowing needs and fund these aggressive share buybacks.
Why Cash Flow is So Important to Pool Corporation
Beyond basic corporate liquidity, cash flow holds specific strategic importance for the company:
It Dictates Executive Compensation: Management relies on “Operational Cash Flow” (specifically measured as adjusted net cash provided by operations) as one of the primary financial performance metrics used to determine the annual cash bonuses for top executives, including the CEO and CFO. The Board believes this metric keeps executives focused on managing inventory and accounts receivable efficiently.
It Enables the Capital Allocation Strategy: Generating strong operating cash flow is the engine that allows management to continually execute its highly disciplined capital allocation priorities—specifically, funding local market share growth while consistently increasing the dividend and buying back stock without over-leveraging the balance sheet.
What I am Watching Going Forward
Inventory turnover: Product inventories are 40% of total assets and management already absorbed margin pressure from carrying excess higher-cost inventory in 2024, so the turn ratio is the cleanest read on working-capital discipline through the next slow season.
Seasonality: Q2 and Q3 generate roughly 60% of sales and over 70% of operating income, as weather in a four-month window dictates the year. A cool, wet spring in the pool-density states breaks the print. In 2025, California, Florida, Texas, and Arizona collectively represented approximately 53% of total net sales.
New installs / consumer demand: New in-ground construction has collapsed from 120K units in 2021 to an estimated 60K in 2025, and further declines pressure the discretionary 14% of revenue.
Costs/Suppliers: Pentair, Zodiac, and Hayward account for 43% of cost of products sold, leaving POOL exposed to pricing actions from three counterparties; tariff and duty regime changes are a separate watch.
FCF: 2025 operating cash flow of $365.9M was distorted by the $68.5M hurricane-deferred tax payment pulled in from 2024, and ex-that adjustment ran at 106.9% of net income—the normalized conversion rate is what funds the buyback and dividend without further leveraging.
CEO transition and rescheduled Investor Day: Watwood’s first quarter and the new Investor Day date are the next opportunities to gauge whether the Arvan-to-Watwood handoff was as rushed as it looked and what strategic shifts arrive with new leadership.
April 14: Company announces May 12 Investor Day in Phoenix
April 23: Arvan reports Q1—sales +6%, op income +7%, reaffirms full-year guidance, says they “remain confident in our strategy”
April 28: Board raises buyback to $600M and lifts dividend 4%
April 29: At the AGM, shareholders re-elect Arvan as a director. Say-on-pay approved
May 4: Arvan out, Watwood (EVP since January 2026) in, board cut to 8, Stokely moves from Chair to Executive Chair at $50K/month
May 7: Stokely buys 1,000 shares at $193.07 and director James Hope buys 464 at $194.42, both open-market—the first insider signal
May 8: 8-K/A discloses Arvan separation terms—54 weeks of base salary, 12 months of health benefits, continued vesting of 55,156 PSAs and 21,870 RSAs, all subject to non-compete, non-disparagement, and clawback
May 12: Investor Day was supposed to happen. Postponed indefinitely
Porpoise goodwill impairment testing: The $401.6M Porpoise balance (current carrying value) accounts for the vast majority of total goodwill and gets retested annually in October.
Average Total Leverage Ratio: Currently 1.73 against a 3.25 covenant ceiling, with $222.6M of incremental debt explicitly used to fund 2025 buybacks; the trajectory matters more than the level.
Insider activity / Form 4s: Watch for 10b5-1 plan changes or unusual selling around the CEO transition, the rescheduled Investor Day, and the next earnings print. Recently, insiders have been buying, a vote of confidence.
Pre-transition buying (Feb–Mar 2026, on the way down from ~$220 to ~$200):
Perez de la Mesa: 5,000 @ $218 (Mar 2), 5,000 @ $205 (Mar 13) = 10,000 shares, $2.12M
St Romain (SVP): 5,560 shares @ ~$218.66 avg (Feb 23) = $1.22M
Hope: 1,405 @ $213.64 (Feb 25) = $300K
Post-transition buying (May 7–13, after the May 4 announcement):
Perez de la Mesa: 10,000 @ $190 (May 7), 10,000 @ $175.95 (May 13) = 20,000 shares, $3.66M
Stokely (new Exec Chair): 1,000 @ $193.07 (May 7) = $193K
Hope: 464 @ $194.42 (May 7) = $90K
Whalen: 525 @ $190.44 (May 8) = $100K—notably outside his DRIP pattern
Perez de la Mesa total since March 2 = 30,000 shares for ~$5.77M, average ~$192.48. And he kept buying as the stock fell—his largest single slug ($1.76M) was on May 13 at the lowest price in the series. He bought into the bad news.
The insider tape is telling a story—the man who chose Arvan, who’s been on the Board for 27 years, who knows the business as well as anyone alive, has been accumulating aggressively through both the broad drawdown and the governance shock. The post-May 4 buys from Stokely, Hope, Whalen, and especially Perez de la Mesa are a coordinated-looking signal that the Board has conviction in Watwood and in the price.
Base business sales growth: The organic same-store metric strips out acquisition contribution and gives the cleanest read on underlying demand and market share gains.
PLEX mix: Management’s flat 29.7% gross margin guide leans on proprietary and exclusive brand sales offsetting dilution from big-ticket equipment, so the mix is the margin story.
ROIC against the 10% bonus gate: Executive bonuses don’t fund below 10% ROIC, which creates a compensation incentive to manage to the line and is worth watching when the metric sits close to it.
Greenfield opening cadence: The 2026 target of 5-8 new sales centers is below the historical 8-10 pace; whether that signals selectivity or caution will show up in the actual count and geography.
Conclusion
At $181, POOL trades near 16.7x TTM with a near-3% yield, a refreshed $600M buyback, a 21-year dividend track record, and a 64% recurring-revenue base that compounds whether the new-construction cycle does or not. The insider tape since May 4 says the people closest to the business view the post-transition selloff as opportunity, not warning—Perez de la Mesa added 20,000 shares at an average price of $183, Stokely bought on his first day as Executive Chair, Hope and Whalen joined at the lows. That’s a coordinated signal from a Board that knows what Watwood inherited and what it’s worth.
This is a buy at current levels, but the conviction is calibrated to what’s still unresolved. The cyclical drag is bottoming, the recurring base is compounding, and the market is pricing the wrong half of the business—that’s the setup. The unfinished work is Watwood’s first quarter and a rescheduled Investor Day. Both will tell us whether the Arvan-to-Watwood handoff was as rushed as it looked and whether strategic shifts arrive that weren’t in the prior playbook. The annuity is what you’re underwriting. The management transition is what could break it.
Bull Thesis
Quality compounder priced like a cyclical distributor. 16.7x trailing earnings, 2.8% yield, 21 total dividend increases (since 2004), 16 consecutive. The COVID-era rerating from 40x to 16x is done.
The recurring base is the business. 64% of revenue is non-discretionary maintenance and minor repair on an aging installed pool base, up from 60% in 2019. Pools age, leak, and need chlorine regardless of housing turnover.
Cyclical bottom is in, by management’s own guide. 2026 new construction “consistent to 2025,” renovation and remodel “flat to slightly up.” The multi-year drag from the discretionary 14% of revenue is officially over.
Q1 2026 inflected on operating leverage. Sales +6%, operating income +7%—the first quarter operating income outpaced top-line since the post-pandemic margin squeeze began.
Insider tape since May 4 is coordinated and aggressive. Perez de la Mesa—27-year director, the man who chose Arvan—added 20,000 shares in May at ~$183 average. His largest single $1.76M slug was at the lowest price in the series. He bought into the bad news.
Stokely stepped in three days into his role as Executive Chair. Hope and Whalen joined at the lows. The Board has conviction in Watwood and in the price.
Buyback cadence proves management’s view of fair value. Q1 2026 deployed $64.4M, with the bulk in March at an average $203.04 across ~295,000 shares. The April refresh added $600M to authorization, arming the company to buy below its own established “value” threshold.
The moat is scale and density. 456 sales centers, ~125,000 wholesale customers, 200,000+ SKUs across 650+ product lines, and the PLEX proprietary and exclusive brand portfolio protecting gross margin against equipment dilution.
Capital return is proven and disciplined. $531M returned in 2025, $3.33B over 2016–2025. Leverage at 1.73 sits comfortably inside the 1.5–2.0 target and well below the 3.25 covenant ceiling.
Cash conversion is exceptional once you strip the noise. 2025 operating cash flow ran 106.9% of net income after backing out the $68.5M hurricane-deferred tax payment. That conversion rate funds the buyback and dividend without leveraging up further.
TAM leaves runway. ~11.0M bodies of water in the U.S., 5.4M in-ground pools, plus a $19.0B irrigation and landscape adjacency. POOL’s market cap of ~$6.61B is a small share of the addressable opportunity.
The setup in one line. The market is pricing the new-construction cycle as the whole story while the recurring annuity compounds underneath.
POOL Historical PE
Diversified Chaos · POOL Deep Dive
If this was useful, hit the like button and subscribe — it genuinely helps.
Disclaimer: This report is for informational and analytical purposes only and does not constitute investment advice. All investments involve risk, including the loss of principal. Consult a qualified financial advisor before acting on any information presented here.
AI Transparency: As an AI-integrated publication, this content is synthesized using large language models and generative tools. While these technologies enhance our research workflow, they may occasionally produce inaccuracies or hallucinations. Please use this series for informational and educational purposes only—it is not a substitute for your own due diligence. All images are AI-assisted and provided for illustrative context.
I welcome your feedback and questions in the comments and will respond to as many as possible.
Very detailed article. Thanks! It expanded my knowledge of this great company. I've been following Pool for years waiting for a good entry point. Perez de la Mesa's buying was the final signal I needed. I bought heavily when it reached around $180 and also sold a lot of cash-secured puts, which offered a great yield while waiting for future lower entry points. Thanks again for the insightful article.